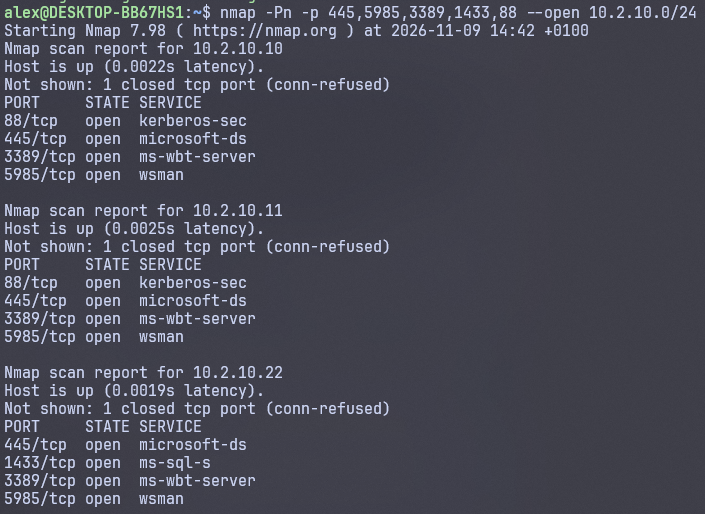
nmap scan of the GOAD-Light network: both domain controllers expose Kerberos (88), SMB (445), RDP (3389) and WinRM (5985), and castelblack adds SQL Server (1433)
The ports that show up here (88, 5985, 3389...) are the same ones that later appear in Kibana as recorded inbound connections.
Scan 10.2.10.0/24 (GOAD). 10.2.20.0/24 is Elastic. From here on it is the usual flow: anonymous SMB and LDAP, Kerberos, enumeration and lateral movement.
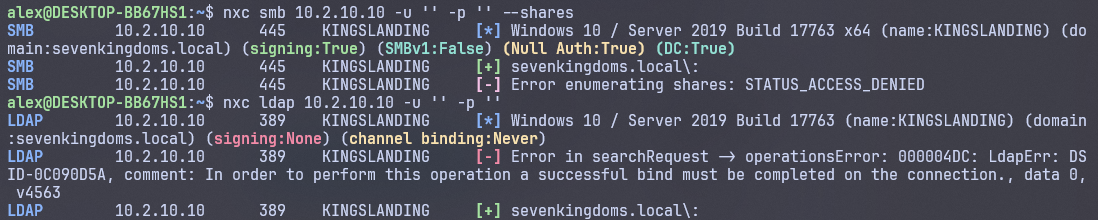
Anonymous enumeration against the domain controller: listing shares returns STATUS_ACCESS_DENIED and the anonymous LDAP bind is rejected
Where each thing shows up in Kibana
There are two places and they get mixed up:
Discover → raw events. Everything the hosts record shows up here
Security → Alerts → only what triggers a detection rule
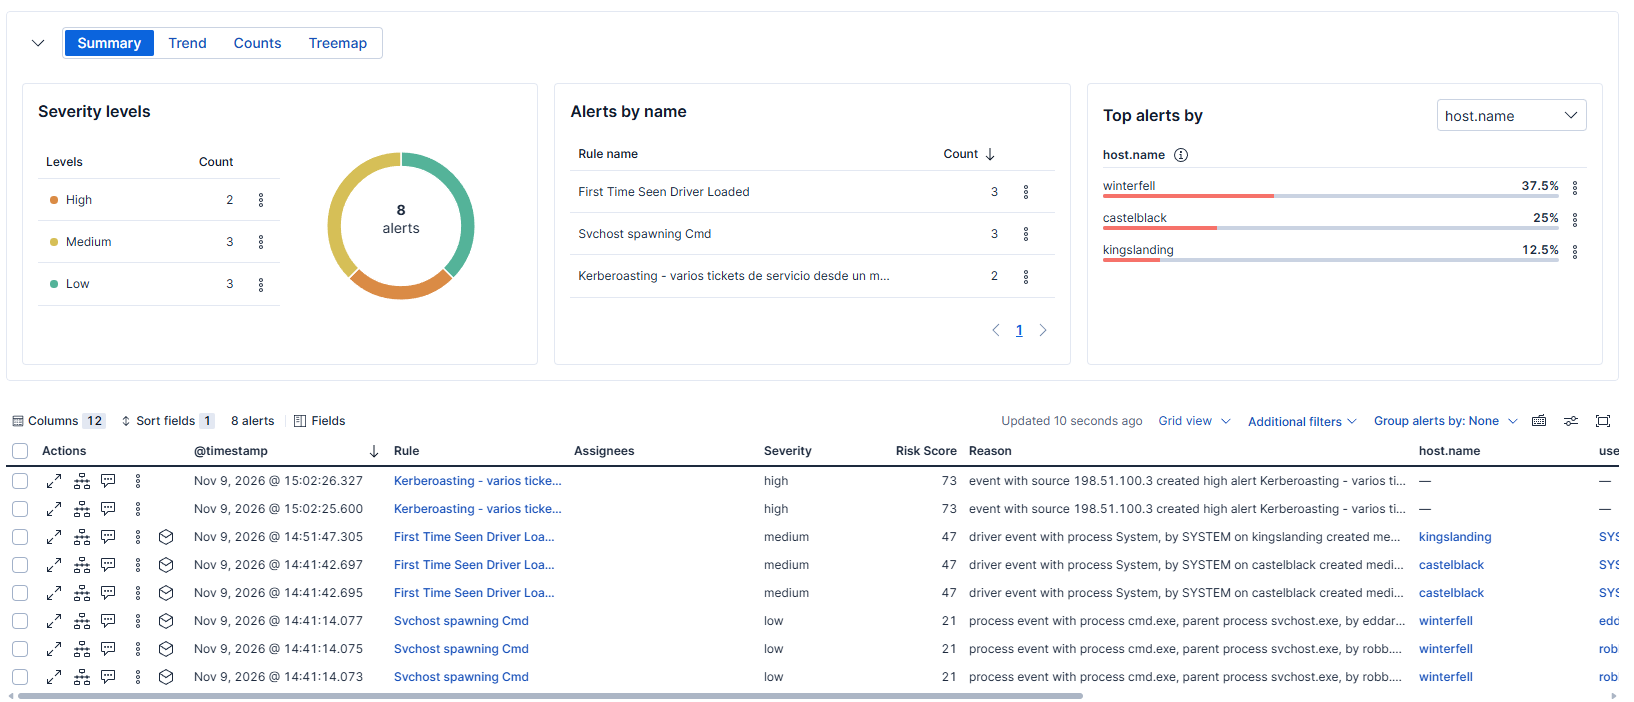
Kibana Security → Alerts with eight alerts: two high-severity ones from the custom Kerberoasting rule, with the tunnel IP as source, and the rest ("Svchost spawning Cmd", "First Time Seen Driver Loaded") is noise from the lab itself when the VMs boot
Create a logs-* data view with @timestamp as the time field and set the time picker to Last 15 minutes. These are the data streams that come in:
system.security → Windows Security events
windows.sysmon_operational → Sysmon
windows.powershell → PowerShell
endpoint.events.* → Elastic Defend
Seeing your own nxc in Kibana and Elasticsearch
Right after running the commands above, open Discover at https://10.2.20.2:5601/app/discover, pick the logs-* data view, set Last 15 minutes and paste this query with your WireGuard tunnel IP (the Address in your .conf):
terminal
source.ip: "198.51.100.3"
What shows up for sure is the anonymous network logon: 4624 events (and 4634 on logoff) with user.name: ANONYMOUS LOGON on the three hosts. The rest (the STATUS_ACCESS_DENIED on the shares or the rejected LDAP bind) depends on each host's auditing, so check it with the query itself. And remember: it is an event in Discover, not an alert, because no default rule covers anonymous logon.
If you prefer to query Elasticsearch directly, use the Kibana console at https://10.2.20.2:5601/app/dev_tools#/console:
The API also answers on port 9200 (https://10.2.20.2:9200) with the elastic user, but from the Kibana console you do not have to deal with the certificate and authentication.
What each nxc action generates
Failed SMB or WinRM login → Security 4625
Valid login → Security 4624 (and 4768/4769 with Kerberos)
Enumerating users and groups → Security 4798 and 4799
Kerberoast / AS-REP → 4769 / 4768
Share access → 5140 / 5145
Execution over WinRM → wsmprovhost.exe process
And KQL queries to paste into Discover:
terminal
event.dataset: "system.security" and winlog.event_id: (4625 or 4771 or 4776)
terminal
winlog.event_id: (4798 or 4799)
terminal
process.name: "wsmprovhost.exe" or process.parent.name: "wsmprovhost.exe"
To see only your activity, filter by your WireGuard tunnel IP (the Address in your .conf):
terminal
source.ip: "<your-tunnel-IP>"
What triggers and what does not
An nxc smb discovery without credentials generates 4624 ANONYMOUS LOGON events (network logon type) on the three hosts, with your tunnel IP as the source. It shows up in Discover but not in Alerts, because there is no default rule for it.
Unauthenticated port scan → generates no logon, but Elastic Defend does record the inbound connections (endpoint.events.network, event.action: connection_accepted, with your IP as source.ip and the port in destination.port). It shows up in Discover, not as an alert
Null session or enumeration → events in Discover, and an alert if a rule covers it ("Windows Account or Group Discovery")
Execution over WinRM → "Incoming Execution via WinRM Remote Shell" alert
LSASS dumping, DCSync → have prebuilt rules
Kerberoast → the prebuilt rule only fires on RC4 tickets (0x17). In my lab the tickets came out with AES256 (0x12) and nothing fired: it took a custom rule
SMB brute force with -u users -p passwords → stays as 4625 events and does not fire on its own
For a sweep or a brute force to show up in Alerts you need to create your own threshold rule. For example:
Name: "SMB brute force - 4625 failures"
Index: logs-system.security-*
Query: event.dataset: system.security and winlog.event_id: 4625
Threshold: more than 10 in 5 minutes, grouped by host.name or user.name
Pings are not visible
ICMP does not create a connection, so neither the Security log, nor Sysmon (event 3 is TCP/UDP only), nor Elastic Defend record it. If you want to see it:
Enable Windows Filtering Platform auditing, which generates 5156/5157 and includes ICMP: